
As of now, Bitcoin’s live price stands at $26,000, marking a 3.36% increase over the last 24 hours. With an impressive 24-hour trading volume of $18.6 billion, Bitcoin maintains its dominant position at #1 on CoinMarketCap.
The cryptocurrency’s current market capitalization is a staggering $506.66 billion, and with a circulating supply of 19,483,481 BTC out of a maximum of 21,000,000 BTC coins, investors and traders are keeping a close eye on its next moves.
Bitcoin Price Prediction
Analyzing the technical facets of Bitcoin, it exhibits a pronounced bullish trend, breaking through a significant resistance at the $25,900 mark.
This resistance was previously reinforced by a downward trend line visible on the four-hour timeframe, which had consistently curbed Bitcoin’s upward momentum.
Nonetheless, during the early trading hours, Bitcoin successfully surged past this barrier, reaching highs of $26,500. This $26,500 level now presents itself as a double top pattern, thereby acting as a formidable resistance for BTC.
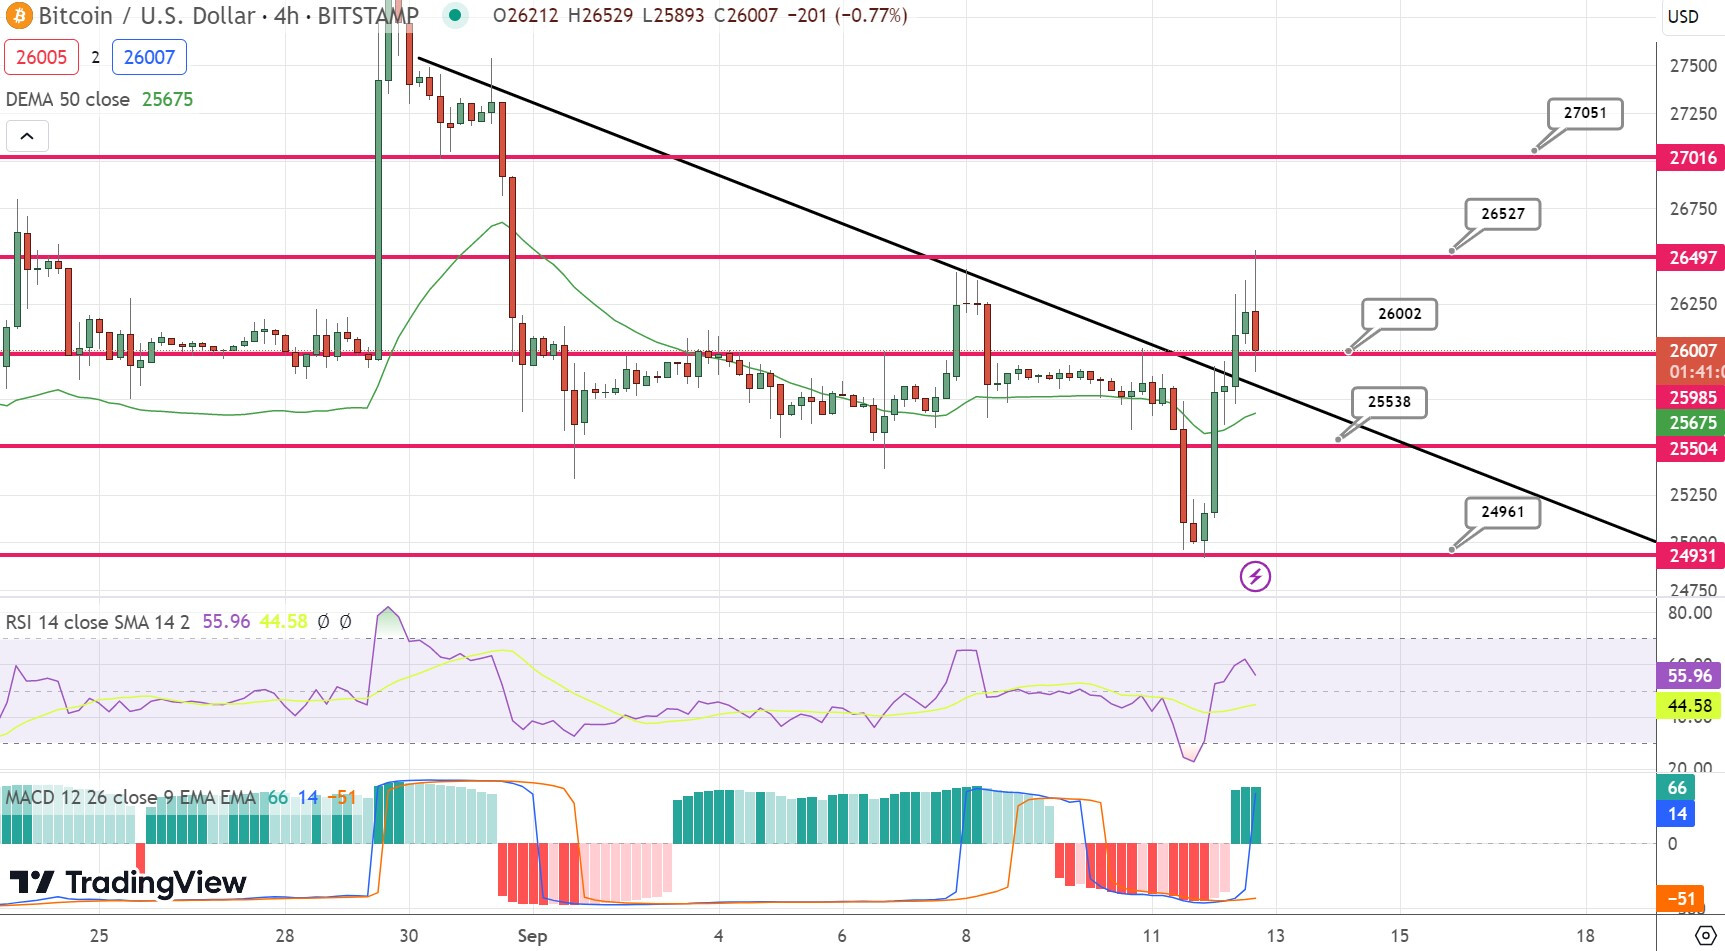
Despite its initial surge, Bitcoin struggled to maintain above the $26,500 threshold and has since retreated to just below the $26,000 mark.
It currently hovers slightly above its previously breached resistance at $25,900, which has now turned into a support level.
When considering primary technical indicators like the Relative Strength Index (RSI) and the Moving Average Convergence Divergence (MACD), both are poised in the buying zone.
Furthermore, the 50-day exponential moving average bolsters the potential for a continued bullish trajectory, as long as BTC sustains above the $25,600 level.
If BTC were to dip below this mark, the subsequent significant support levels to watch would be $25,400 and the crucial $24,950 mark.
Conversely, should BTC surpass the $26,500 resistance, potential targets would be the $27,000 and $27,500 levels.
In essence, the $26,500 mark serves as a pivotal point: values below might hint at bearishness, whereas figures above could signal bullish continuation.